Make Statistics Videos Online for Free
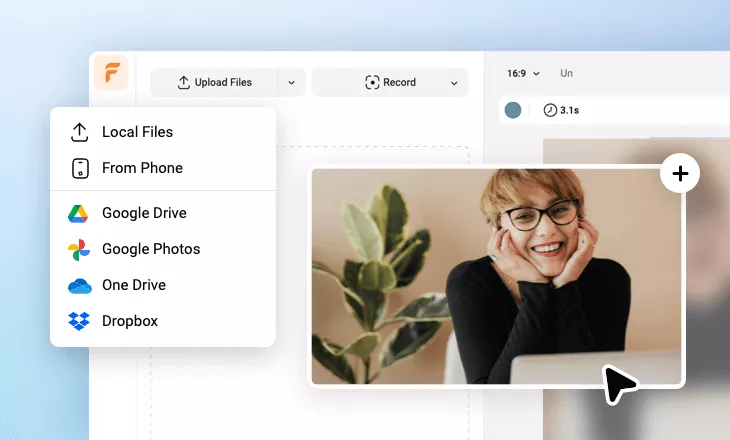
With comprehensive free statistics video templates, charts, reports, infographics, listicles, graphs and AI tools, FlexClip's free statistics video maker is powerful for your video strategy implementation for either statistics marketing or statistics education. Upload your media files for a quick edit and merge, then explore data, chart, reports, infographics, comparison, lists and more statistics elements to insert and create clear statistics visuals. AI features can help animate data and pictures to create a rich statistics video, presentation, explainer or intro. PPT-to-video will automate the conversion of statistics PPT contents and produce a powerful statistics video, as well. You may in need of AI translation, AI subtitle and text-to-speech features for creating statistics video faster and reaching a broader audiences. Easily present your data and perspectives visually with FlexClip. Try it for yourself for free now!
Turn PPT to Statistics Video Handy video editor
 Rich video templates
 Extensive media library
 Dynamic text animations
- Trusted by:


Professional Statistics Video Templates for Free
 PreviewAI Recreate
Modern Company Report Sample
 PreviewAI Recreate
Business Report
 PreviewAI Recreate
Professional Annual Company Report Business Video
 PreviewAI Recreate
Research Report Presentation
 PreviewAI Recreate
World Cup Football Soccer Match Game Team Pk Youtube Intro
 PreviewAI Recreate
Business Simple Project Report
 PreviewAI Recreate
First Quarter Report
 PreviewAI Recreate
Tech Style Big Data Impact Listcle
 PreviewAI Recreate
Blue Orange 3d Business Report
 PreviewAI Recreate
Corporate Company Business Annual Report
 PreviewAI Recreate
Business Quarterly Report Presentation
 PreviewAI Recreate
Sales Report
Statistics Video for Free Editing


Why You Need to Make a Statistics Video

Boost Sales
A compelling video can absolutely influence buying behavior, leading directly to sales.

Increase Traffic
Nothing can compare to the power of video content when it comes to driving traffic to your site.

Encourage Social Shares
Videos on social media platforms generate more likes and shares than images and text combined.
How to Make a Statistics Video in 3 Steps
- 1
Add Media
Add videos or photos from computer or stock libraries to the scene.
- 2
Customize
Add text, music, and voiceover to customize your statistics video.
- 3
Export
Download your statistics video in various ratios and definitions or share it online with the world.