
線上免費製作數據統計影片
用影片來展示數據會更加直觀有效。試試用FlexClip做個影片,向別人展示你的統計成果吧!這裏有數百萬影片和圖片素材供你使用。強大的編輯工具讓你能輕鬆做出滿意的效果,即使是新手也能快速掌握。快來試試吧!
免費製作影片 簡單的影片編輯器
 種類繁多的範本
 海量媒體庫資源
 動態文本
動態文本
- Trusted by:


專業的數據統計影片範本
 預覽AI剪同款
現代公司報告樣本
 預覽AI剪同款
業務報告
 預覽AI剪同款
專業年度公司報告業務視頻
 預覽AI剪同款
研究報告介紹
 預覽AI剪同款
世界盃足球賽比賽團隊PK YouTube簡介
 預覽AI剪同款
業務簡單項目報告
 預覽AI剪同款
一季報
 預覽AI剪同款
技術風格大數據影響清單
 預覽AI剪同款
藍橙 3d 業務報告
 預覽AI剪同款
公司-公司-業務年度報告
 預覽AI剪同款
業務季度報告演示
 預覽AI剪同款
銷售報告
免費編輯、下載數據統計影片


為什麼要做數據統計影片範本

促進銷售
一個引人注目的影片能更大程度地影響購買行為、促進銷售。

增加流量
在推動網站流量方面,沒有什麼能與影片內容相比。

鼓勵社交分享
社交媒體平臺上的影片獲得的贊和分享比圖片和文字加起來還要多。
數據統計影片製作三步曲
- 1
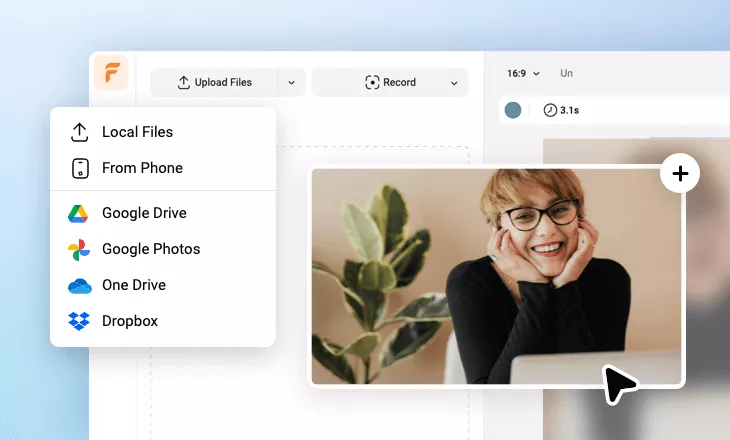
添加媒體檔
從電腦中上傳影片、圖片,或者從資源庫中添加素材到故事版。
- 2
編輯
添加文本、音樂、畫外音等來編輯你的數據統計影片。
- 3
輸出
選擇合適的比例和清晰度下載數據統計影片,然後分享給其他人。

輕鬆線上製作數據統計影片
免費製作影片